- #135
- #134
- #133
- #132
- #131
- #130
- #129
- #128
- #127
- #126
- #125
- #124
- #123
- #122
- #121
- #120
- #119
- #118
- #117
- #116
- #115
- #114
- #113
- #112
- #111
- #110
- #109
- #108
- #107
- #106
- #105
- #104
- #103
- #102
- #101
- #100
- #99
- #98
- #97
- #96
- #95
- #94
- #93
- #92
- #91
- #90
- #89
- #88
- #87
- #86
- #85
- #84
- #83
- #82
- #81
- #80
- #79
- #78
- #77
- #76
- #75
- #74
- #73
- #72
- #71
- #70
- #69
- #68
- #67
- #66
- #65
- #64
- #63
- #62
- #61
- #60
- #59
- #58
- #57
- #56
- #55
- #54
- #53
- #52
- #51
- #50
- #49
- #48
- #47
- #46
- #45
- #44
- #43
- #42
- #41
- #40
- #39
- #38
- #37
- #36
- #35
- #34
- #33
- #32
- #31
- #30
- #29
- #28
- #27
- #26
- #25
- #24
- #23
- #22
- #21
- #20
Visualizing JSON Data - JSON Crack
Sharing a great tool I use for visualizing data — JSON Crack
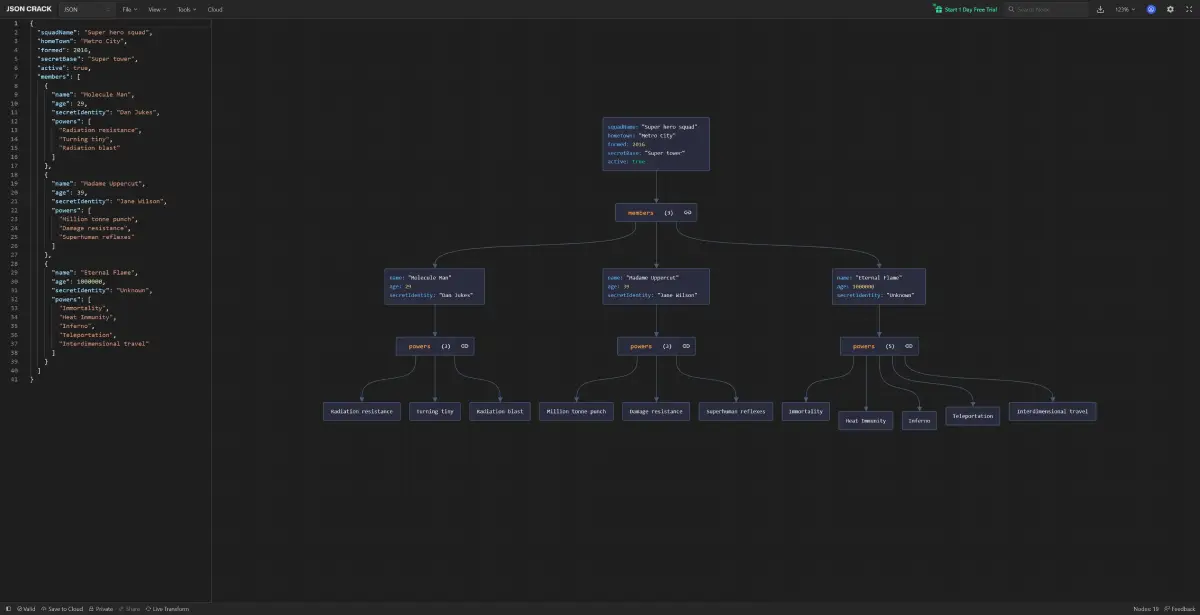
Sometimes, when you get a large response from a third-party API, it can be quite challenging to read and find the target data. In such cases, visualizing the data can be very helpful. JSON Crack is an online tool that converts JSON (or other common data formats) into charts.
For me, its highlights are:
- Visualized data
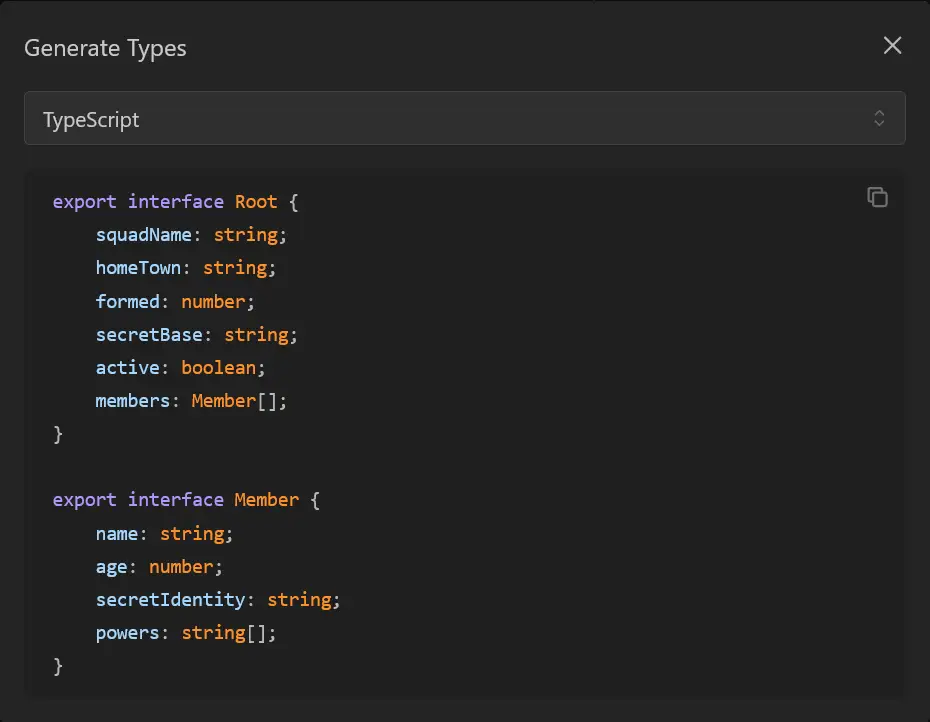
- Automatic type generation
- Free and no login required
- #19
- #18
- #17
- #16
- #15
- #14
- #13
- #12
- #11
- #10
- #9
- #8
- #7
- #6
- #5
- #4
- #3
- #2
- #1