Chcek Website Performance with Lighthouse CI in 3 Steps
Introduction
Recently, I added Lighthouse CI to this blog for web performance testing. Previously, I relied on manual tools like PageSpeed Insights for testing, but this approach has several drawbacks:
- Unstable results from single tests
- Time-consuming manual testing
- Not good to team development
I hope to automate performance checks so that I don’t have to wait a long time to know if a page has performance or accessibility issues, allowing for timely fixes when problems arise.
Lighthouse CI
Step 1: Install the Lighthouse GitHub App (optional)
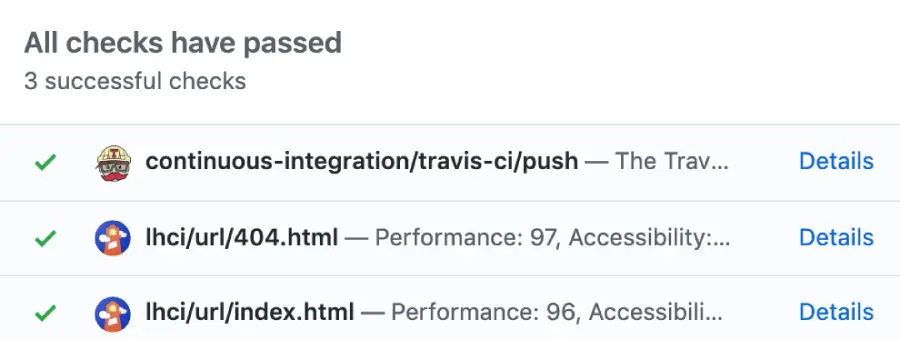
Lighthouse has integrated the log into the GitHub Status list, and the officially recommended authorization method is to use GitHub App to install it in the specified repository. You can go to the corresponding page and click a few buttons to easily obtain the Token for CI processes.

LHCI_GITHUB_APP_TOKEN is usually stored in project’s Secrets for CI use.
Step 2: Create a Configuration File
You can create a Lighthouse CI configuration file at the root of your project, supporting various file formats. For my blog, I use .lighthouserc.yml for configuration:
ci:  collect:    numberOfRuns: 3
  assert:    preset: 'lighthouse:no-pwa'    assertions:      csp-xss: 'warn'      total-byte-weight: 'off' # TODO: enable this when this bug is fixed: https://github.com/GoogleChrome/lighthouse-ci/issues/1001      identical-links-same-purpose: 'off'
  upload:    target: 'temporary-public-storage'    # upload options here
  server:    # server options here
  wizard:    # wizard options here
You can refer to the Lighthouse CI configuration file for how to set up performance testing, such as how many times to test, the depth of the test folder, and where to store the results, etc. Currently, my configuration disables some unnecessary checks, PWA validation, and sets the number of tests per page to 3. By default, it will detect all pages in the dist folder of my project.
Step 3: Generate Test Reports
After creating the configuration file, you can run Lighthouse CI to generate test reports. My approach is to download the package @lhci/cli and add a command in package.json to run it locally:
"scripts": { "lighthouse": "lhci autorun"}Once the existing issues are fixed locally, you can move the entire process to CI. Here, I use GitHub Action to run Lighthouse CI:
lighthouse:  runs-on: ubuntu-latest  env:    # Step one optional    LHCI_GITHUB_APP_TOKEN: ${{ secrets.LHCI_GITHUB_APP_TOKEN }}
    # ... set up the environment
  - name: Build    run: pnpm build
  - name: Lighthouse    run: pnpm lhci autorun
Summary
In just 3 steps, I easily added Lighthouse CI to my website to check web performance. There’s no need to manually test each page; performance issues can be automatically detected with every code submission. This approach is a great performance testing tool for team development and allows developers to fix issues more quickly. You can refer to this PR to understand how I added Lighthouse CI to my blog.